| Information on this page provided by California Water Research, 2015 |
Myths and Facts about a Drought Year in the San Joaquin Valley
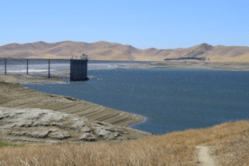 Figure 1. San Luis Reservoir, August 2013. Source: Maven’s Notebook |
Myth: The Endangered Species Act restrictions are causing farmers to lose water. The first part of 2013 has seen the driest six months in the historical record. As of August, 2013, the San Luis Reservoir is 18 percent full and being depleted quickly. Farmers on the west side of the San Joaquin Valley are short of surface water to irrigate their crops, and are blaming Endangered Species Act restrictions on the large Central Valley Project and State Water Project pumps in the Sacramento-San Joaquin Delta. |
Hundreds of thousands of acres of land are fallowed. Many west side farmers say it is because of a “Man-made drought.”
Fact: The drought is real and the agricultural industry is being impacted by other long-term trends. Closer examination shows that the cause of land fallowing on the west side of the San Joaquin Valley is much more complex. The drought is real, not man-made, and the agricultural industry in the San Joaquin Valley is being impacted by several long-term trends, including salinization of soil, depletion and contamination of groundwater, and increasing population growth and demand for water in Southern California cities.
Summary of the Myths and Facts (Click Links for Details)
Information from several previously published “Myths and Facts” sheets about water supply and impacts on San Joaquin Valley agriculture are collected and updated in this paper, as well as some new information.
- Myths and Facts about Water Exports from the Delta
On average, total exports from the Sacramento-San-Joaquin Delta have decreased slightly since a 2000-2007, but have increased from every other decade. Average Central Valley Project exports to the San Joaquin Valley have gone up slightly since the 1990s and down slightly since the 2000s.
Most of the cutbacks in water exports in 2007-2009 and 2012-2013 were due to drought.
- Myths and Facts about Agricultural Jobs in Mendota
According to the California Employment Development Department, employment in Mendota and other rural areas in Fresno has changed little over the past decade. The estimated population in Mendota has increased, but employment has not kept pace. Part of the cause may be that depletion and contamination of groundwater in Mendota and other nearby towns has severely limited the municipal water supply.
- Myths and Facts about Land Fallowing in Westlands Water District
Satellite maps show that most of the fallowed land in Westlands Water District is retired land that had seen declining crop yields due to accumulated salt in the soil. Since 2002, over 100,000 acres of impaired land has been acquired by Westlands Water District and retired from irrigated production. The water has been transferred to other land in the District, often to grow water-thirsty permanent crops.
- Myths and Facts about Westlands Soil
After decades of over-irrigation of saline soils, about half of the soil in Westlands Water District is moderately to severely impaired by accumulated salts. As much as one third of Westlands’ land has no groundwater fit for drinking or irrigation.
- Myths and Facts about Westlands Water Supply
Growers on the west side of the San Joaquin Valley have always needed to rely on groundwater to carry them over in dry years. Depletion and contamination of groundwater with salt and boron has severely impacted drought year supplies.
Conclusion
Over-irrigation of saline soils on the west side of the San Joaquin Valley has led to severe declines in crop yields and large scale fallowing of impaired land. Depletion and contamination of groundwater supplies with salt and boron has also severely limited the productivity of the remaining land in drought years.
Groundwater was also the water supply for Mendota and other small rural towns on the west side of the San Joaquin Valley. These towns are now dependent on small, fixed supplies of imported surface water from the Central Valley Project. Combined with the impact of land retirement, their future is dim.
Details:
Myths and Facts about Water Exports from the Delta
Myth: The Endangered Species Act is responsible for large cutbacks in water deliveries to the San Joaquin Valley from the Sacramento Bay-Delta.
Fact: Total water exports from the Delta have actually increased substantially since 1990-2000. As a result of the CALFED Record of Decision, from 2000 to 2004, the State Water Project pumps were ramped up from a maximum pumping rate of 6680 cfs to 8500 cfs, increasing State Water Project exports from the Delta by almost a million acre feet a year.1
The increase in pumping entrained large numbers of migrating Chinook salmon and spawning Delta smelt, driving these endangered fish populations towards extinction. In 2008 and 2009 the US Fish and Wildlife Service and National Marine Fisheries Service issued new Biological Opinions which set limits on pumping in the Delta during critical migration and spawning times. The new limits are projected to reduce State Water Project exports by an average of 351,000 acre feet per year from the unsustainable levels in 2000-2007.2 Central Valley Project exports, which had increased very little, were cut less.
  |
Figure 2. Difference in water exported by the State Water Project and Central Valley Project Delta pumps from 1973-2012 average, by decade. Source: Dayflow Data 3
Most of the reduction in Delta exports in 2007-2009 and 2012-2013 have been due to drought.
Myths and Facts about Agricultural Jobs in Mendota
Myth: The high rate of unemployment in Mendota and other rural towns on the west side of the San Joaquin Valley could be alleviated by gutting Endangered Species Act restrictions on pumping water in the Delta.
Fact: The California Employment Development Department estimates that employment in Mendota and other small towns in Fresno County has changed little in the last decade. According to EDD estimates, unemployment in Mendota has grown because the population has grown and employment has not.
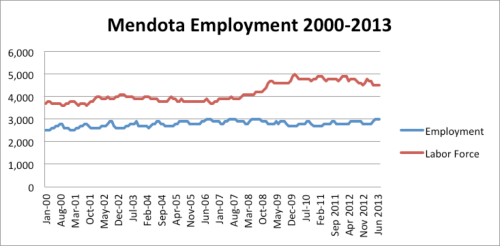
Figure 3. Mendota Employment Chart
Myths and Facts about Land Fallowing in Westlands Water District
Myth: Hundreds of thousands of acres of land in Westlands Water District have been fallowed in recent years due to Endangered Species Act restrictions: over 200,000 acres of land in 2009, 170,000 acres in 2010, and 113,000 acres in 2012. Over 170,000 acres is projected to be fallowed in 2013.
Fact: Westlands Water District has initially claimed 25%-39% more fallowed land than was later reported in their crop reports. On the crop reports, the District reported 156,000 acres fallowed in 2009; 122,000 in 2010, and 90,000 in 2012.5,6,7
The crop reports also do not identify the cause of the land fallowing. Satellite maps show that a large part of the fallowed acreage is land that acquired for Westlands’ massive land retirement program, to settle landowner claims over lack of drainage and unequal water allocations. Since 2002, over 100,000 acres has been acquired by the District and retired from irrigated production. (see maps below)
The District has reallocated the imported surface water to other lands within Westlands, often to supply almonds and other high profit permanent crops which require large amounts of water.
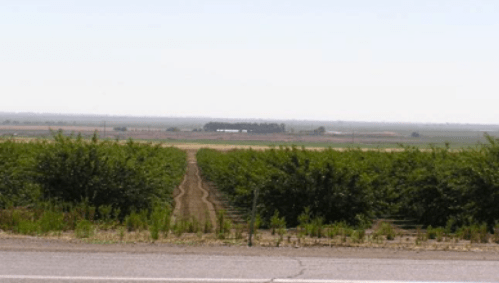
Figure 5. Almond orchards in Westlands, July 2011
Source: California Water Research

Figure 6. Dark green=crops, Tan =bare land, fallowed. Source: The Water Agency, Inc.8
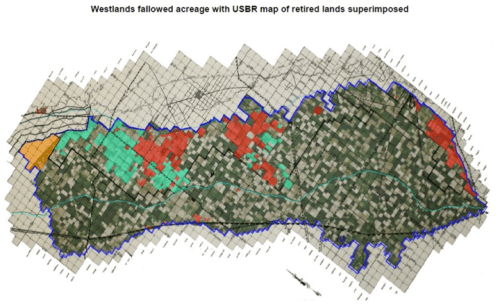
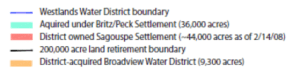
Figure 7. Map of retired lands overlaid on 2009 satellite map. Source: US Bureau of Reclamation.
Westlands Land Retirement to date:
[Blue] Britz/ Sumner Peck Settlement (2002): The U.S. Bureau of Reclamation paid over $100 million to buy and retire 37,100 acres of land impaired by salt and poor drainage, containing toxic loads of selenium, arsenic, boron and other trace minerals.9 A covenant forbidding irrigation of the lands was recorded on the deeds, and the lands were given to Westlands Water District to manage.
[Red] Sagouspe Settlement (2002): Separate from the USBR retirement program, Westlands Water District agreed to buy another 65,000 acres of impaired land, and reallocate the contracted water to equalize water contracts in the district. As of February 14, 2008, the district had acquired over 44,000 acres.
[Orange] Broadview acquisition (2006): The entire Broadview irrigation district was acquired in 2006. The 9,500 acres of impaired land were fallowed and the water reallocated.10
200,000 acre boundary: Over 200,000 acres of land is significantly impaired, including over 100,000 currently retired acres.11 The Bureau of Reclamation has proposed retiring the rest.
Westlands is including all of the retired acreage in its annual crop reports.12
Myths and Facts about Westlands Soil and Groundwater
Myth: The West side of the San Joaquin Valley has some of the most fertile and productive land in the nation.
Fact: Westside soils have high loads of salt and toxic minerals. Providing drainage is difficult and extremely expensive. On-farm drainage is expected to cost over $2.6 billion for the San Luis unit water districts, including Westlands, and funds have not been identified to pay for it.13
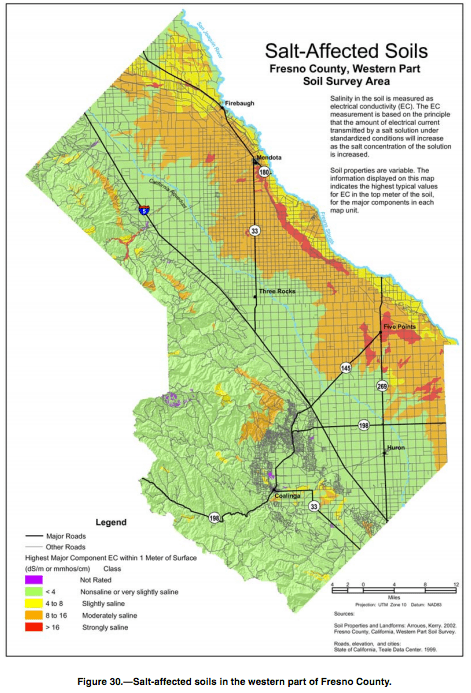
Figure 8. Salt-Affected Soils. Source: US Department of Agriculture, Soil Survey of Fresno County, Western Part
As a result of lack of drainage and continued high irrigation, a USDA survey found that 50% of the land on the west side of Fresno County is saline-sodic, and moderately to significantly impaired in the crops it can grow, up from 33% in 1980.14 (orange area on adjacent map).
Most of the 100,000 acres in Westlands that were acquired as part of federal and district land retirement programs had seen declining yields due to soil salinity and were going out of production for economic reasons.15 Another 100,000 acres in Westlands are expected to go out of production in coming decades.
| Myth: The drought year water supply for the west side of the San Joaquin Valley has been severely curtailed by pumping cutbacks in the Delta.
Fact: Growers on the west side have junior water contracts, and have always needed to rely on groundwater to carry them over in dry years. But decades of irrigation of saline soils has caused extensive contamination of the deep aquifers on the west side with salt, boron, and other toxic minerals. In Westlands Water District, the 2009 Deep Groundwater survey showed approximately 35% of the land has deep aquifers so contaminated that there is no groundwater fit for drinking or irrigation without dilution.16 |
 Figure 9. Salt evaporation basin, western Tulare Lake region, July 2011, showing the amount of salt in irrigation tailwater. Source: California Water Research |
Most of the retired land is in areas with saline groundwater, as well as saline soils.
Myths and Facts about Westlands Water Supply
 Figure 10. Westlands WaterSupply |
This is a graph of Westlands’ reported water supply from 2007 to 2009, exclusive of transfers acquired by individual growers.17 By 2009, the water supply was 64% groundwater.
Even with extensive land retirement and fallowing in areas with contaminated groundwater, the district reported 41,000 acres of crops as “non-harvested” in 2009, a significant proportion were due to irrigation with poor quality groundwater. |
Recent computer modeling has raised questions about the sustainability of irrigated agriculture on the west side of the Valley due to salinization of the deep aquifers.18
| Myth: With sufficient water, Westlands’ retired lands will be brought back into production.
Fact: The future of retired, impaired land in Westlands Water District is uncertain. Providing on-farm drainage to the land would cost more than the land is worth. While the retired land can be dry farmed with wheat or barley, the yields are low enough that dry farming is rarely profitable. Alternative crops, including biofuels, are being investigated. In the meantime, much of the retired land is regularly disked and sprayed with herbicides, creating vast expanses of bare soil in the district, which causes blowing dust in nearby towns. |
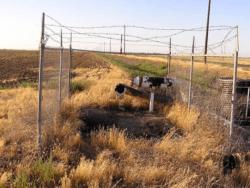 Figure 11. Rusted Irrigation Pipe, retired land, Westlands Water District, July 2011 Source: California Water Research |
The District had promised restoration of some of the 44,000 acres of land acquired from the Bureau of Reclamation to upland habitat, but restoration is proceeding slowly due to lack of funding.
References
- National Resources Defense Council, The Return Of The Backroom Water Deal: Why the Napa Agreement Threatens California’s Water Future, Jan 13, 2004. Available at
http://www.citizen.org/documents/RETURNBACKROOMWATERDEAL.pdf Accessed on August 20, 2013. - Department of Water Resources, 2011 State Water Project Water Reliability Report, p. 38 Available at
http://baydeltaoffice.water.ca.gov/swpreliability/FINAL2011DRR_DWR_Review_File-clean-6-25-12.pdf Accessed on August 20, 2013 - Dayflow data is compiled by the Department of Water Resources. Available at http://www.water.ca.gov/dayflow/output/Output.cfm. Accessed on August 20, 2013.
- Westlands Water District, Analysis of Economic Impacts of Proposed Land Retirement in Westlands Water District, 2002.
- Westlands Water District, 2009 Crop Acreage Report. http://www.westlandswater.org/wwd/crop_reports/2009/croprpt.pdf?title=2009 Accessed on August 20, 2013.
- Westlands Water District, 2010 Crop Acreage Report, http://www.westlandswater.org/wwd/crop_reports/2010/croprpt.pdf?title=2010 Accessed on August 20, 2013.
- Westlands Water District, 2012 Crop Acreage Report,
http://www.westlandswater.org/wwd/crop_reports/2012/croprpt.pdf Accessed on August 20, 2013. - The Water Agency, Inc. Federal and State Water Supply Outlook.
- U.S. Bureau of Reclamation, Statement on Settlement of Sumner Peck Ranch, Inc. v. Bureau of Reclamation. December 10, 2002
- U.S. Bureau of Reclamation, Approval of Annexation of Lands and CVP Water Supply Contract Assignment from Broadview Water District to Westlands Water District, Draft EA, Dec 2005
- US Bureau of Reclamation, San Luis Drain Feature Re-Evaluation, 2006
- US Bureau of Reclamation, Final Environmental Assessment, Non-irrigation Covenant Exchange, EA 06-76 http://www.usbr.gov/mp/nepa/documentShow.cfm?Doc_ID=2348
- US Bureau of Reclamation, San Luis Drain Feature Re-Evaluation Feasibility Study, 2008. Total cost of drainage is $2.7 billion. http://www.usbr.gov/mp/sccao/sld/docs/sldfr_report/slfr_3-08_v02.pdf Accessed on August 20, 2013.
- US Department of Agriculture, Soil Survey of Fresno County, Western Part
http://soildatamart.nrcs.usda.gov/Manuscripts/CA653/0/fresno.pdf Accessed on August 20, 2013. - Westlands Water District, Analysis of Economic Impacts of Proposed Land Retirement in Westlands Water District, 2002.
- Westlands Water District, Deep Groundwater Conditions Report, 2009 http://www.westlandswater.org/short%5C200904%5C525r08.pdf Accessed on August 20, 2013.
- Westlands Water District, Annual Water Supply and Use, Available at http://www.westlandswater.org/resources/watersupply/supply.asp?title=Annual%20Water%20Use%20and%20Supply&cwide=1600 Accessed on August 20, 2013.
- Schoups et. al. Sustainability of irrigated agriculture in the San Joaquin Valley, California. Proc. Natl. Acad. Sci October 25, 2005, http://www.ncbi.nlm.nih.gov/pubmed/16230610 Accessed on August 20, 2013.


0 Responses to “Myths/Facts”